Utilization Metrics
Metrics refer to the availability of resources such as vCPU, memory, disk, RAM, etc. The EdgeXR platform collects metrics for both cluster instances and application instances.
Collecting resource metrics is useful if you use them in conjunction with alerts that can help you identify issues and quickly respond to them. For example, you can set alerts and be notified when you have exceeded the threshold for vCPU. Metric information can also be useful when you want to understand the utilization of your resources to determine the percentage of your resource's capacity that is in use and whether to increase them based on user demand.
Monitoring Dashboard
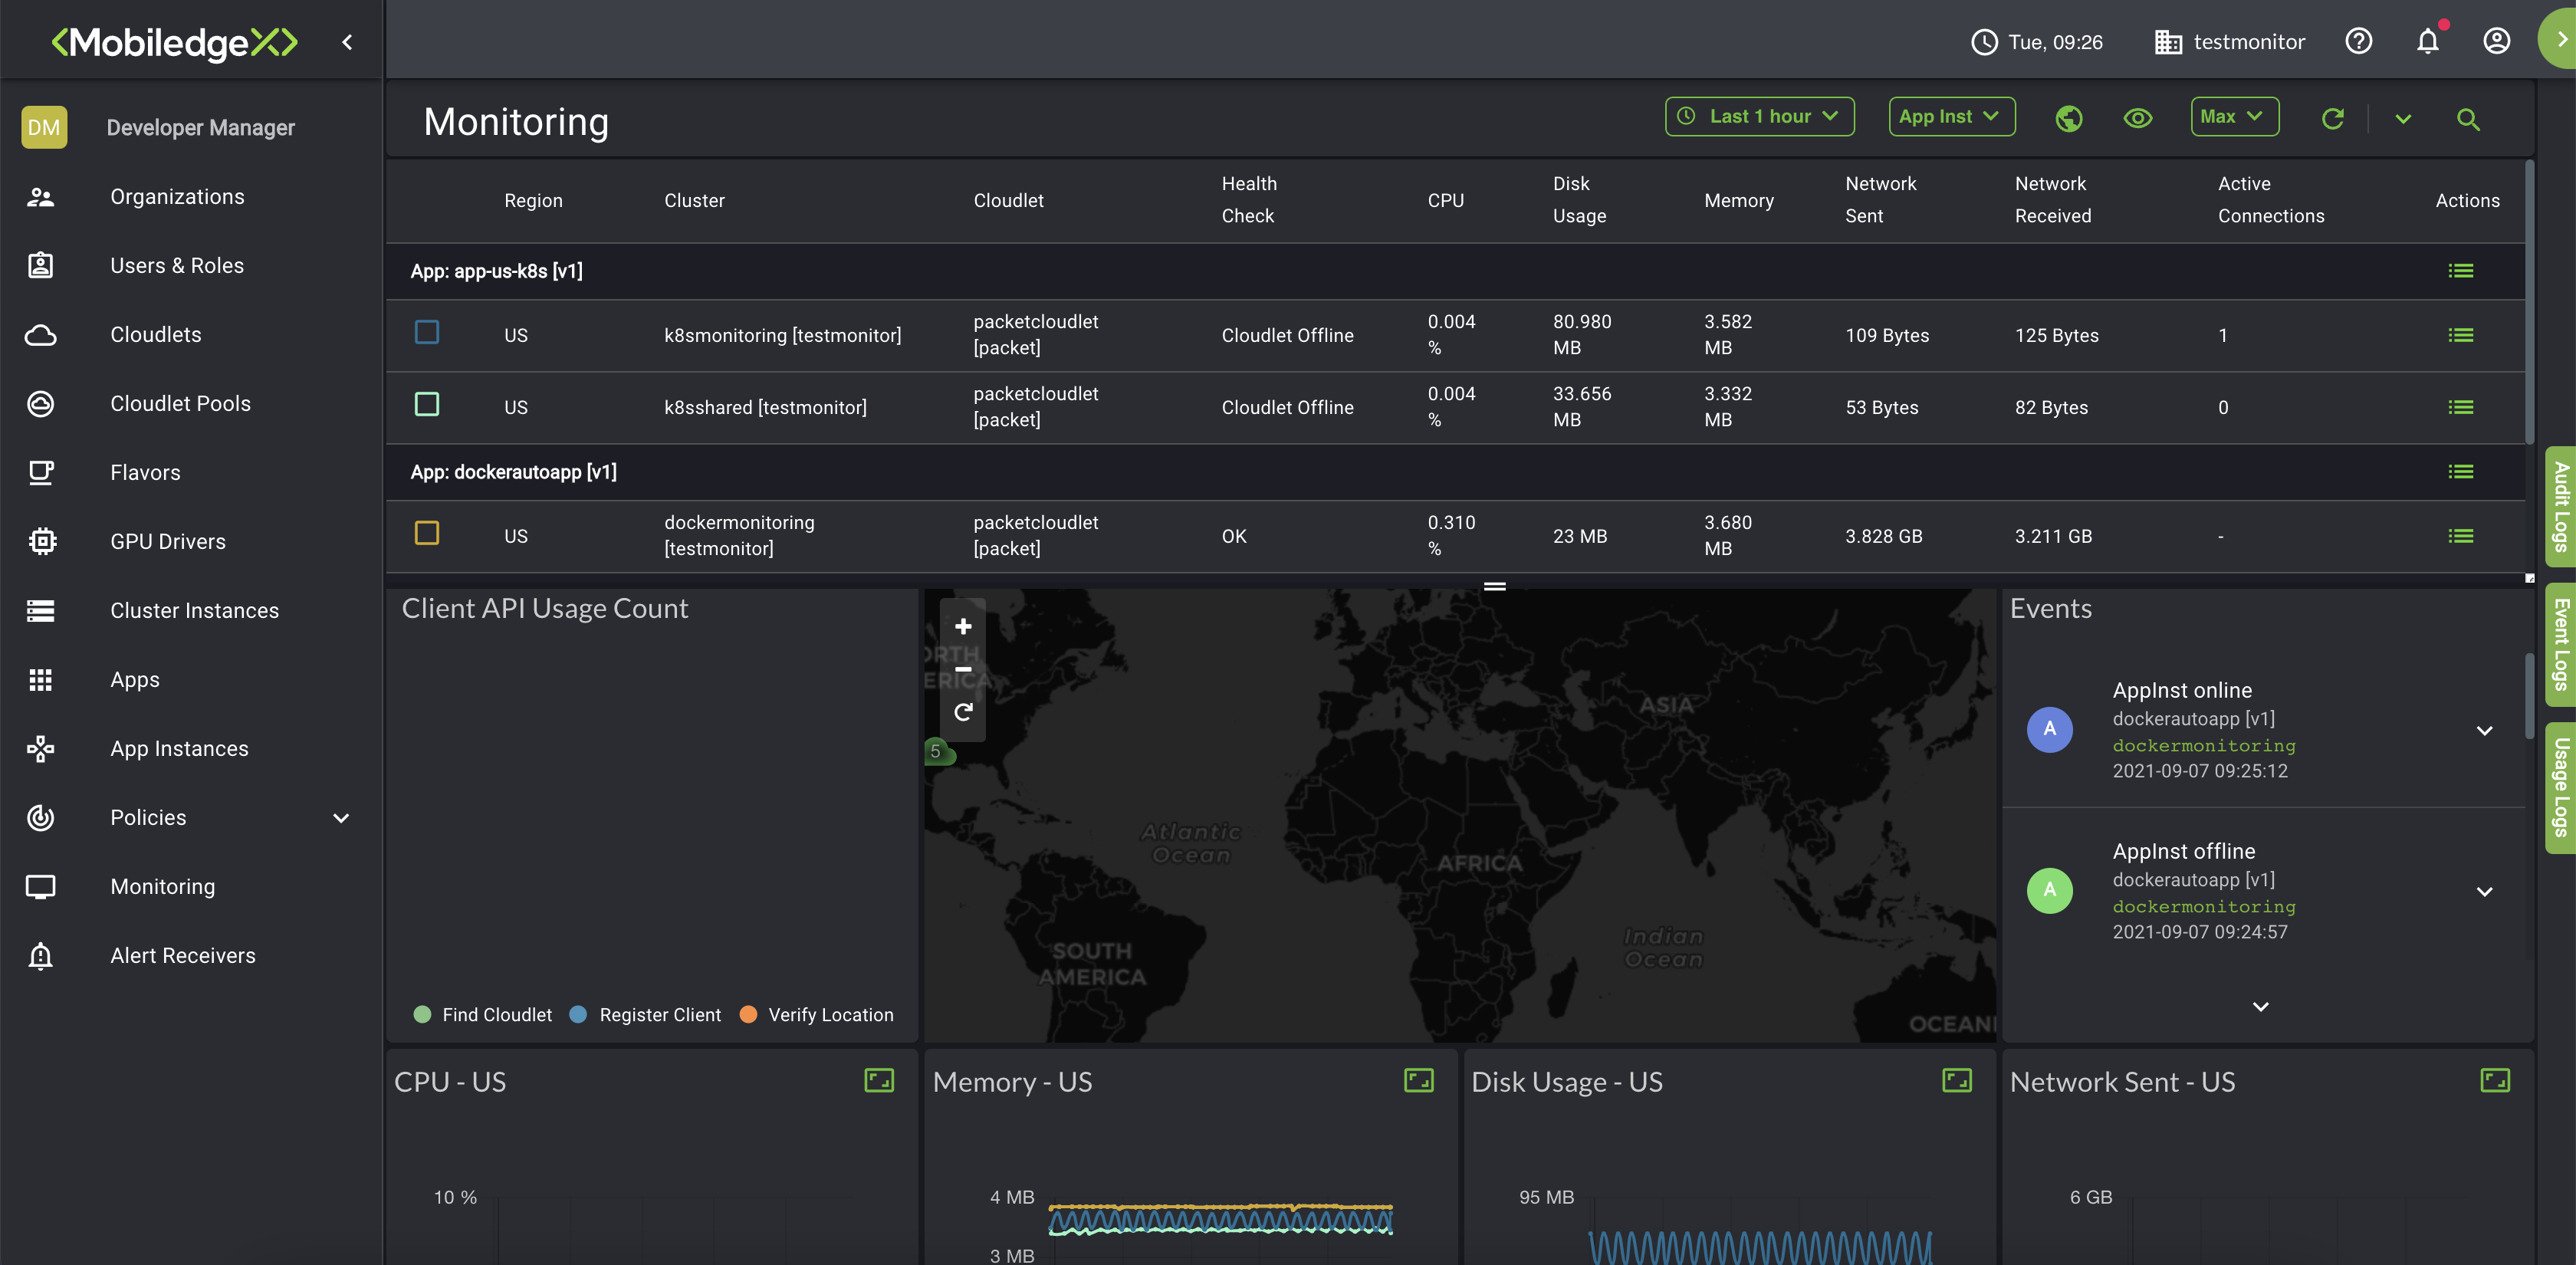
From the Edge-Cloud Console UI, select Monitoring from the left navigation. The Monitoring page opens. Make sure that you are managing the Organization that you wish to view metrics information.
The EdgeXR Edge-Cloud Console provides a Monitoring Dashboard to help you visually centralize, collect, aggregate, and analyze events so that you can get a bigger picture of what is going on across your infrastructure in real-time. Within a single pane of glass and a customizable UI to enlarge your view and change the graphic representation of your data, you can view both current and historical data, log and analyze pattern usages and trends to make informed decisions about your infrastructure to help your users get the most out of your services offered.
Filtering
The Monitoring Dashboard provides many ways to filter the data you need to view and access. You can view by organization, regions, metric types, app instance, cluster instance or cloudlet, and search by admins, developers, or operators. You can also filter by time ranges. While the maximum allocated days you can search for audit logs is one day (within the last 24hrs), you can further refine your search for logs with the span of the 24 hour period. Start time default is 12:00a.m. and End Time default is 11:59p.m.

The toolbar at the top of the Monitoring page contains many options for filtering data.

Organization icon: This allows you to choose which Organization you want to manage. This icon is helpful when you are not on the Organization page. Selecting this icon will create a dropdown menu of all your organizations.
Time Range button: This allows you to filter data in absolute and in relative time ranges.
Instance button: Here, you can select either App Instance or Cluster Instance.
Region icon: Select between US and EU for data.
Visibility icon: Select what data sets you want to see on your Monitoring dashboard.
This dropdown menu will let you view aggregate utilization of resources between given start and end time.
Refresh icon
Refresh Rate icon: Select rate of latency
Search: Will let you filter the observed app/cluster instances by searching for names or keywords.
You can also refresh your data and specify your refresh rate by seconds, minutes, or hours. You will see a progress bar at the top of the page which serves as an indicator. Click the eye icon to customize your view and include specific metrics information.
You may find the following information displayed on your Monitoring Dashboard:
Cluster level resource utilization, performance, and status metrics
Load balancer (Layer 4) metrics and status
Application Instance resource utilization, performance, and status metrics
Application Instance event logs, showing state changes and other Application Instance events
Distributed Matching Engine (DME) metrics, including location-based metrics for remote users
Metrics Reference
The following table provides a list of metrics and their details for each cluster, application instance, and cloudlets. Head over to the mcctl Utility Reference guide for more information on their commands and example usages.
Cluster metrics
Metric | Measurement Unit | Measurement Detail |
CPU | Percentage | CPU usage expressed as a percentage of allocated CPU. |
MEM | Percentage | Memory usage expressed as a percentage of allocated Memory. |
DISK | Percentage | Filesystem usage expressed as a percentage of available disk. |
NET | Bytes/Sec | Transmit and Received data expressed as bytes/sec averaged over sixty seconds (60s) |
TCP | Integer | Total number of tcp connections / retransmissions expressed as an integer. |
UDP | Integer | Total number of udp datagrams transmitted and received, plus any errors expressed as an integer. |
Application instances
Metric | Measurement Unit | Measurement Detail |
CPU | Percentage | CPU usage expressed as a percentage of allocated CPU. |
MEM | Bytes | Memory footprint expressed in Bytes. |
DISK | Bytes | Filesystem usage expressed in Bytes. |
NET | Bytes/Sec | Transmit and Received data expressed as bytes/sec averaged over sixty seconds (60s) |
Connections per Port (Bytes Sent/Received) | Bytes/Sec | Bytes sent/received averaged over sixty seconds (60s). |
Connections per Port (Sessions) | Sessions | Count for accepted, handled, and active sessions. |
Connections per Port (Session Time Histogram) | Connection time in ms. | Data is reported for:
|