Usage Logs & Events
Last Modified: 11/18/21
Types of Logs
Historical activities performed by you and others within your organization are logged and viewed from the Edge-Cloud Console. Logs are used for diagnostic purposes or error correction and are logged and displayed by date and time. Event logs provide valuable information if you require assistance from EdgeXR support teams. To forward logs to EdgeXR, just copy and paste the traceid. Then, email the traceid to [email protected]. Other log types are available. Please see below.
Audit Logs: Logs user activities such as logging, creating applications, deleting users, creating policies, etc.
Event Logs: These are system-generated events and can include services such as auto-provision policy, auto-scaling, application instance, or HA, where our platform will trigger events based on these user policies.
Usage Logs: These logs are generated to view the status (online or offline) of clusters, application instances status, or Cloudlets, and maintenance status.
Event Logs
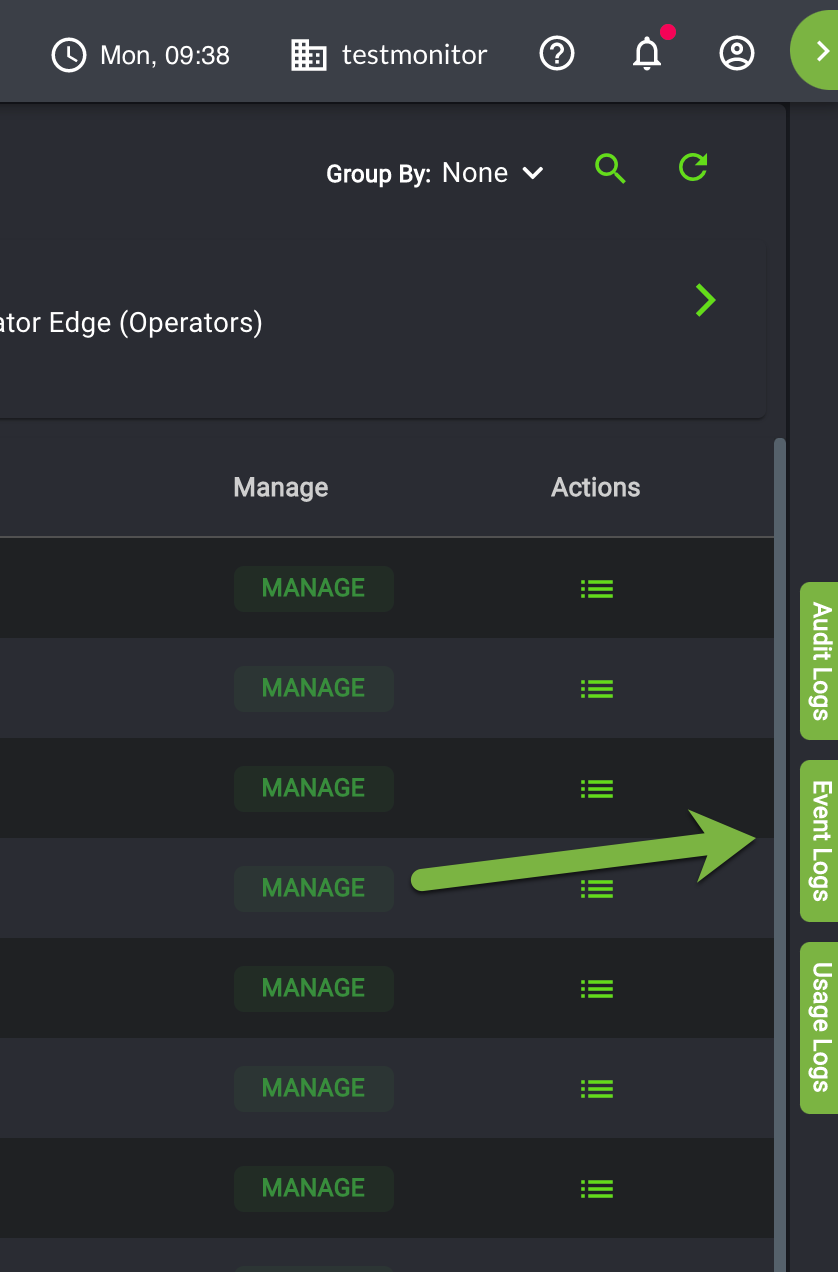
On the right side of the EdgeXR console is the Logs Column. The Logs Column contains three icons, Audit Logs, Event Logs, and Usage Logs. Select Events Logs from the menu.
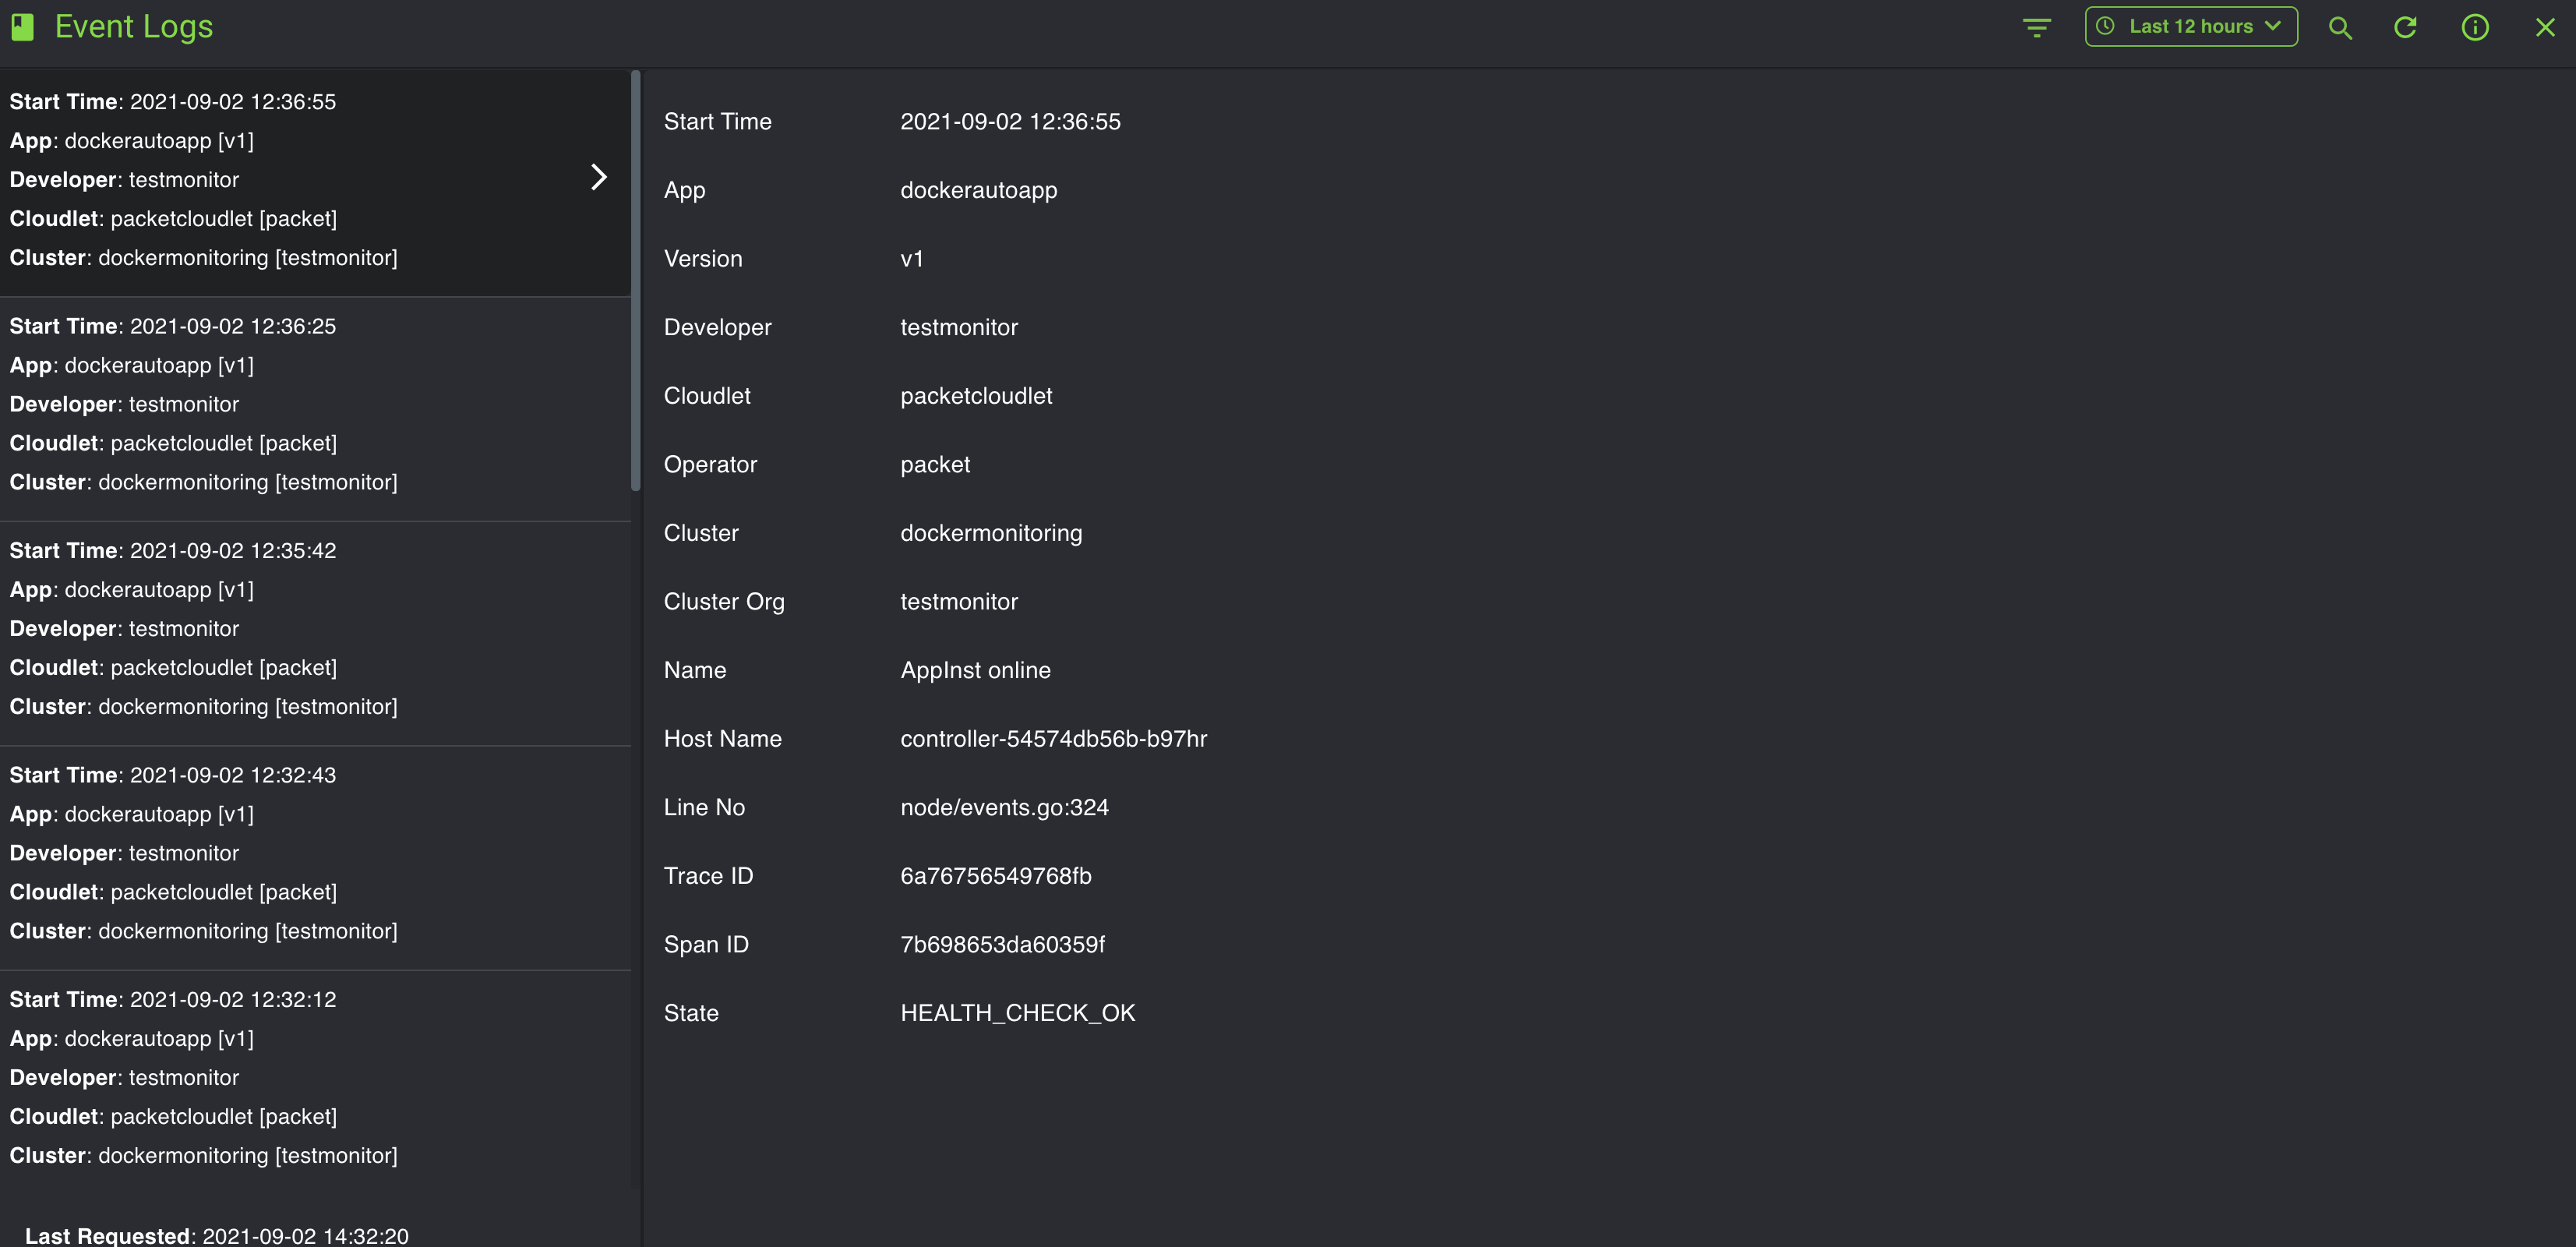
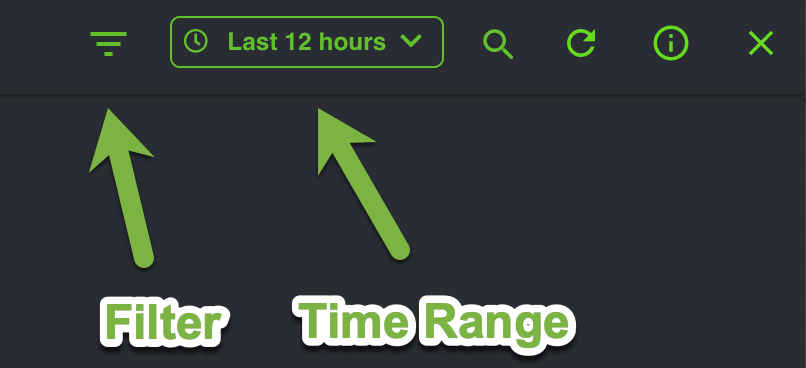
You will see a Live view of the Events Log. From the Live view, you can also go to a more specific search by using the Filter icon or the Time Range icon.
Select the filter icon on the top left.
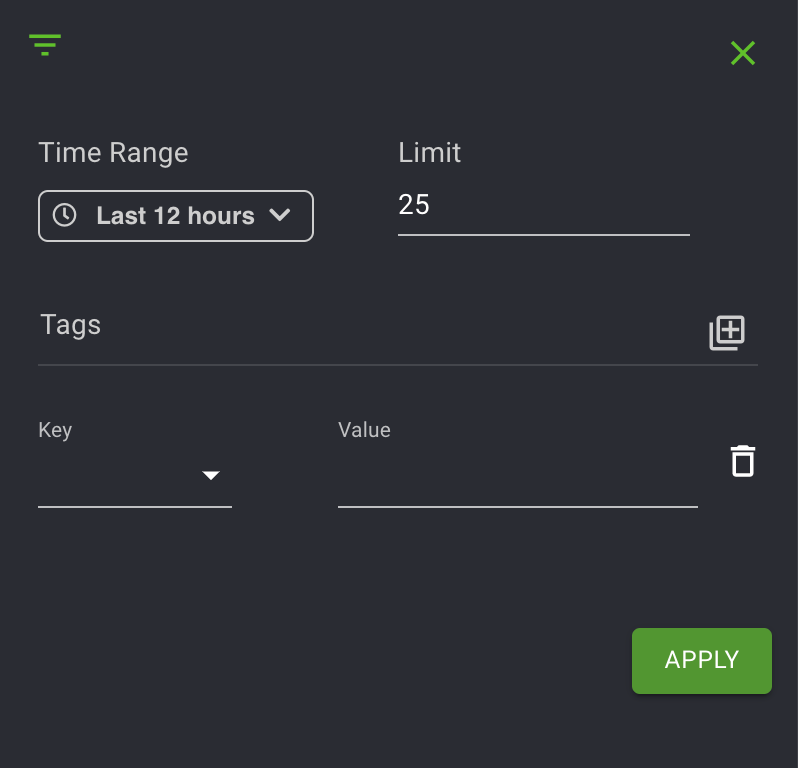
You will see the Filter and Tags option, along with a Time range. Click the + sign to expand the Tags. If you do not wish to enter a value for your selected tag, you can input an asterisk in the Value field. Click the + sign multiple times if you wish to add a query using additional tags.
Tags are a list of objects that you can use to query your search. Scroll through the options in the Tag list, specify a date range, and click Apply. The availability of tags is specific to your role as developer.
Events list
The following table lists the events supported by our platform.
|
|
|
|
|
|
|
|
|
|
|
|
| App Inst Online |
|
|
|
|
|
|
|
|
| |
|
|
| |
|
|
| |
|
| ||
Audit Logs
You can exit out of the Event Logs page by selecting the X icon in the top right of your screen. You will be returned to whichever page from the left navigation you had previously selected. Now the Logs Column will reappear.
Select Audit Logs from the Logs Column.
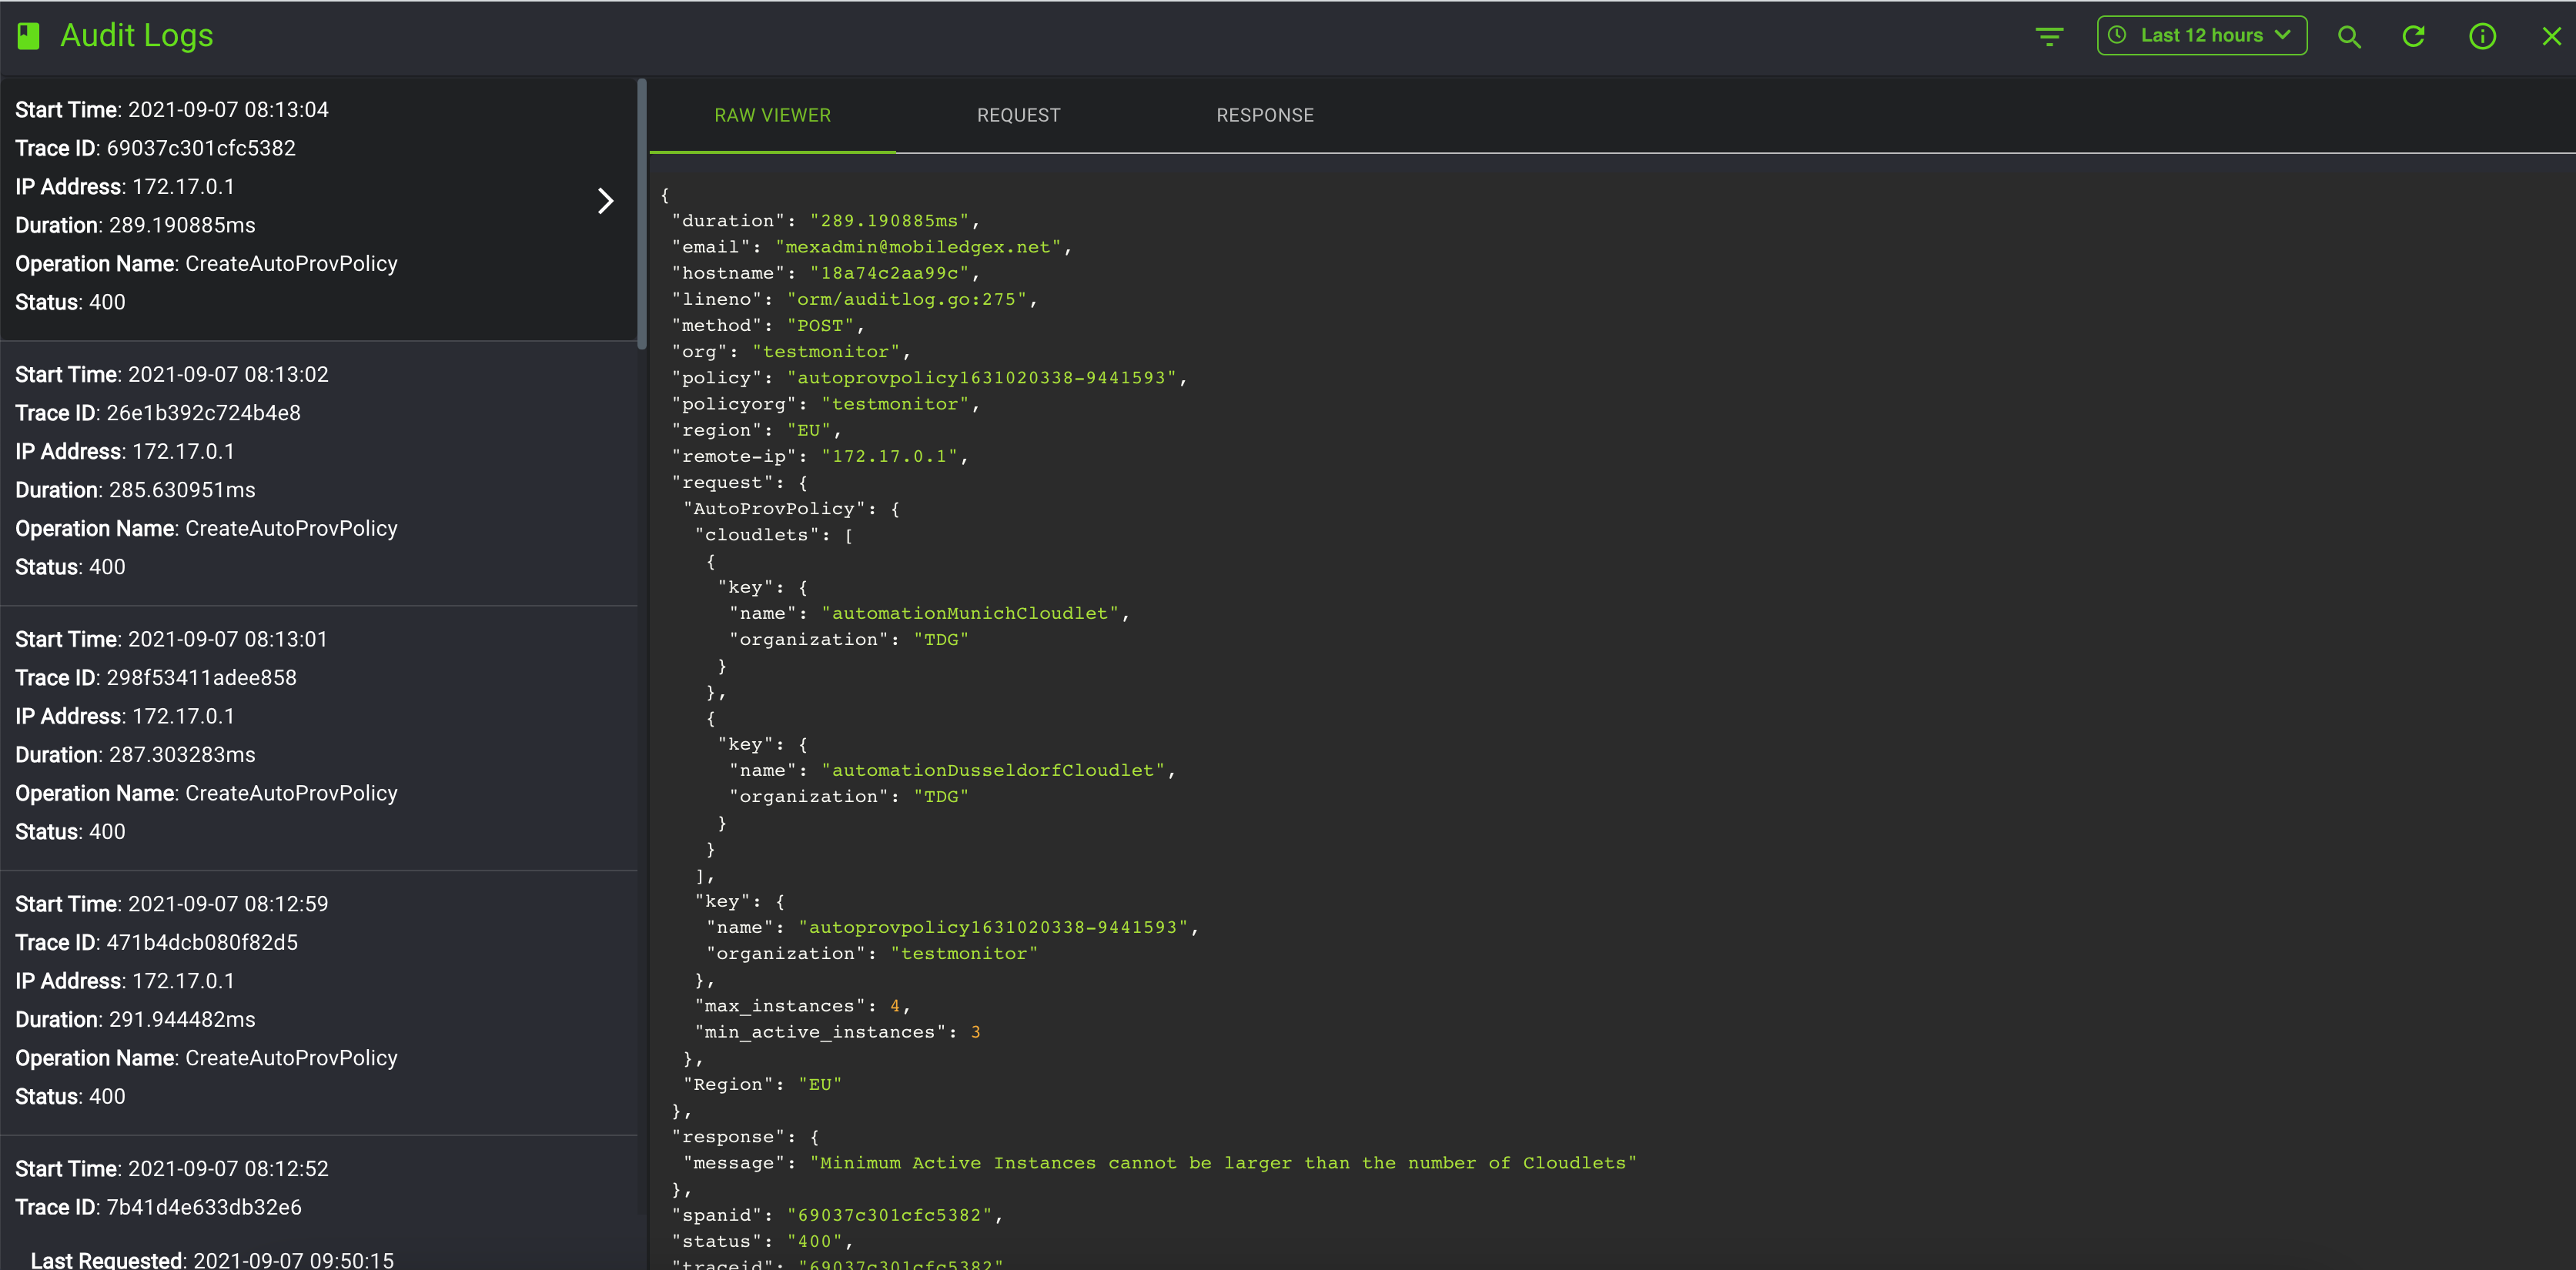
This will pull up the Audit Logs page, which allows you to view a record of historical events performed by you, your organization's members, or the system. As mentioned earlier, each event is associated with a TraceID. If you run into an error you need assistance with, please send the Trace ID to EdgeXR Support to assist with troubleshooting.
Usage Logs
You can view application usage (application instances) across client devices, locations, and the number of users connected to those applications. Using this data over time helps you understand the application activity that is occurring within your cloudlets, where you can drill down into specific events and uncover usage trends to measure user engagement. Additionally, you can also retrieve usage information about cluster instances and cloudlet pools. The ability to view cloudlets and cloudlet pool usage are strictly for operators; developers do not have the ability to view usage logs outside of cluster instances and application instances.
Usage logs pull data in from your existing configurations for application instances, clusters, cloudlets, etc. Therefore, if you delete an app instance, for example, and refresh the Usage log, the usage log will indicate that it was deleted.
Select Usage Logs from the Logs Column.
The following is an example screen displayed when you click Usage log.
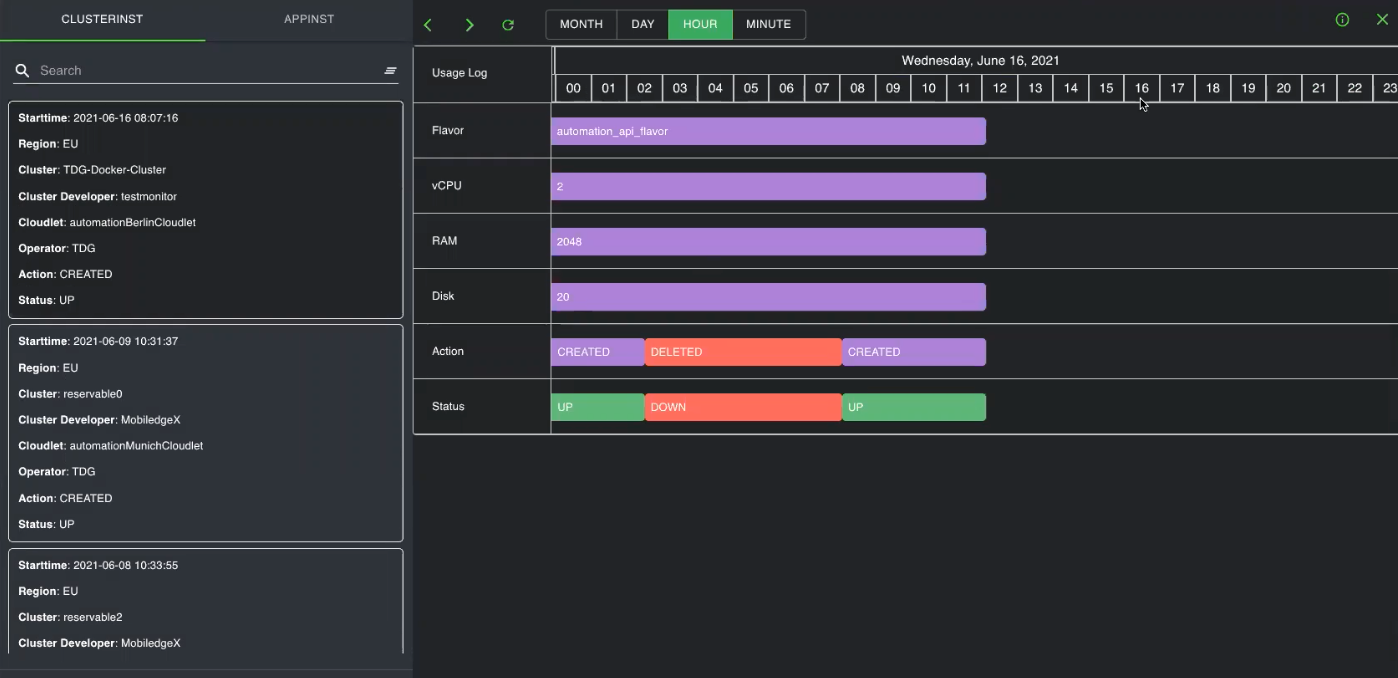
The left panel contains tabs to view detailed information about cluster instances, app instances, etc., depending on your selections. Underneath those options are specific information detailing things such as start time, region, action, status, etc. You can view the items specific to the available selection--cluster instance, app instance, cloudlets, etc. For example, if you want to see a cluster instance usage log, you will see items like Flavors, vCPU, RAM, and Disk.
The right panel contains the actual usage logs for these objects where you can view information such as actions and status. You may filter the logs based on month, day, hour, or minute. The left and right arrow icons will move through selections of the highlighted time interval. If you would like to return to the current time interval, select the Today icon, which looks like a calendar. The time interval can be changed by selecting Month, Day, Hour, or Minute.

The Action row contains color-coded bars, indicating whether something was created or deleted while the Status row contains color-coded bars to indicated whether the object is up or down. By clicking and holding the bar, you can expand your view to extend the dates.