Monitoring Edge Events
View Edge Events
You can view client application data and usage called edge events through our Monitoring console. These are statistical aggregated data; there are no location data stored about the users or devices. When viewing developer metrics for these events, you can view latency statistics which can be filtered based on application instances, locations, and the type of data network used, such as 4G, or 5G. Device information statistics are aggregated over the application instance, device OS, device model, and carrier.
The following options are available:

Show Latency Metrics- Displays the latency values sent by the device to the DME.
Request Latency Metrics- Sends a request to the device to send latency values.
Track Devices-Displays a map of all devices that are registered with a cloudlet. Maps are updated in real-time as new devices register. See the example below.
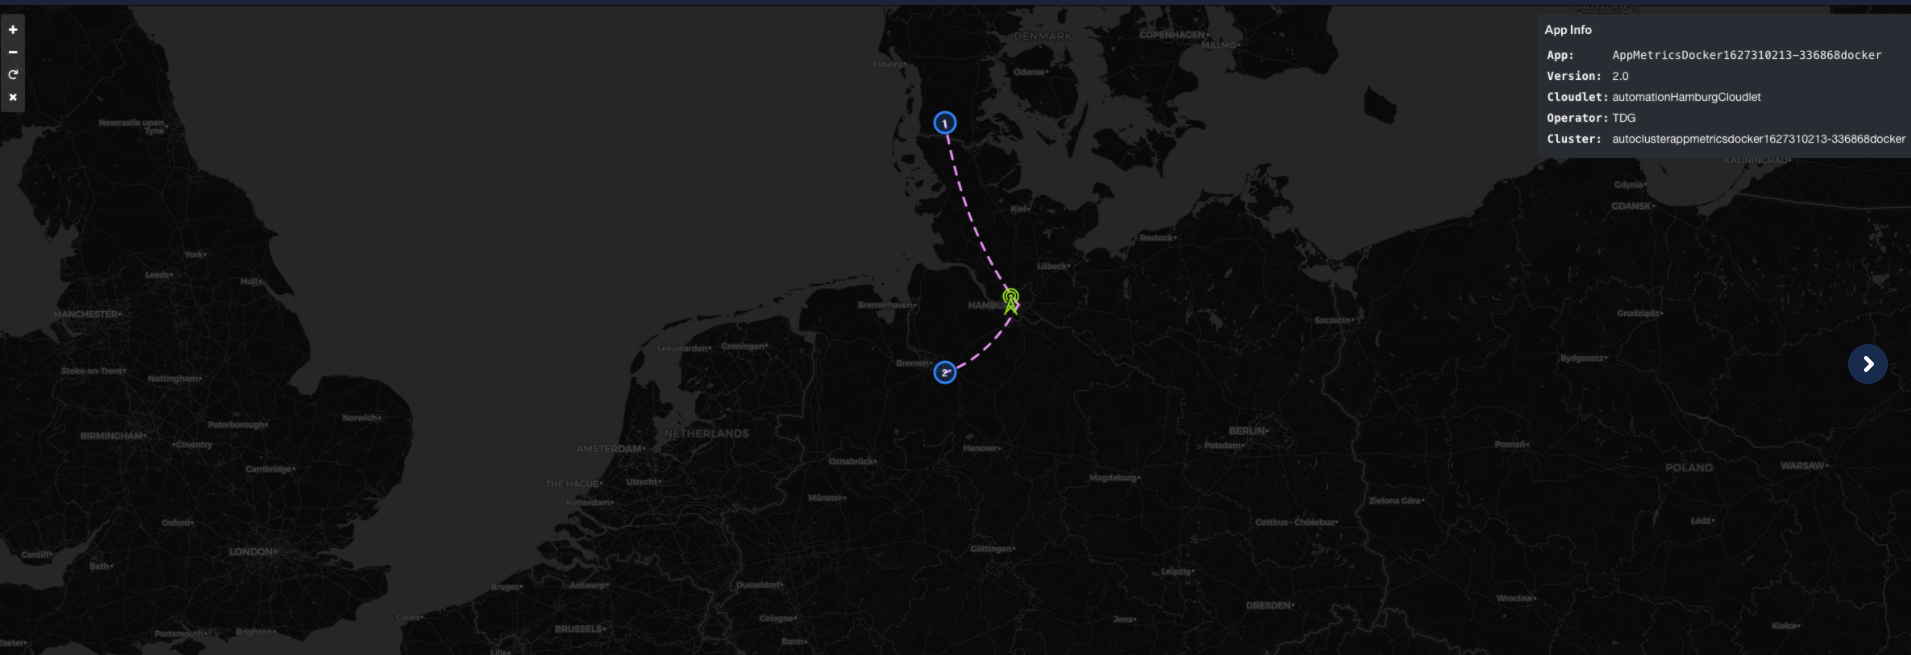
To view edge events:
From the Monitoring page, choose a specific application instance and click Actions > Show Latency Metrics.
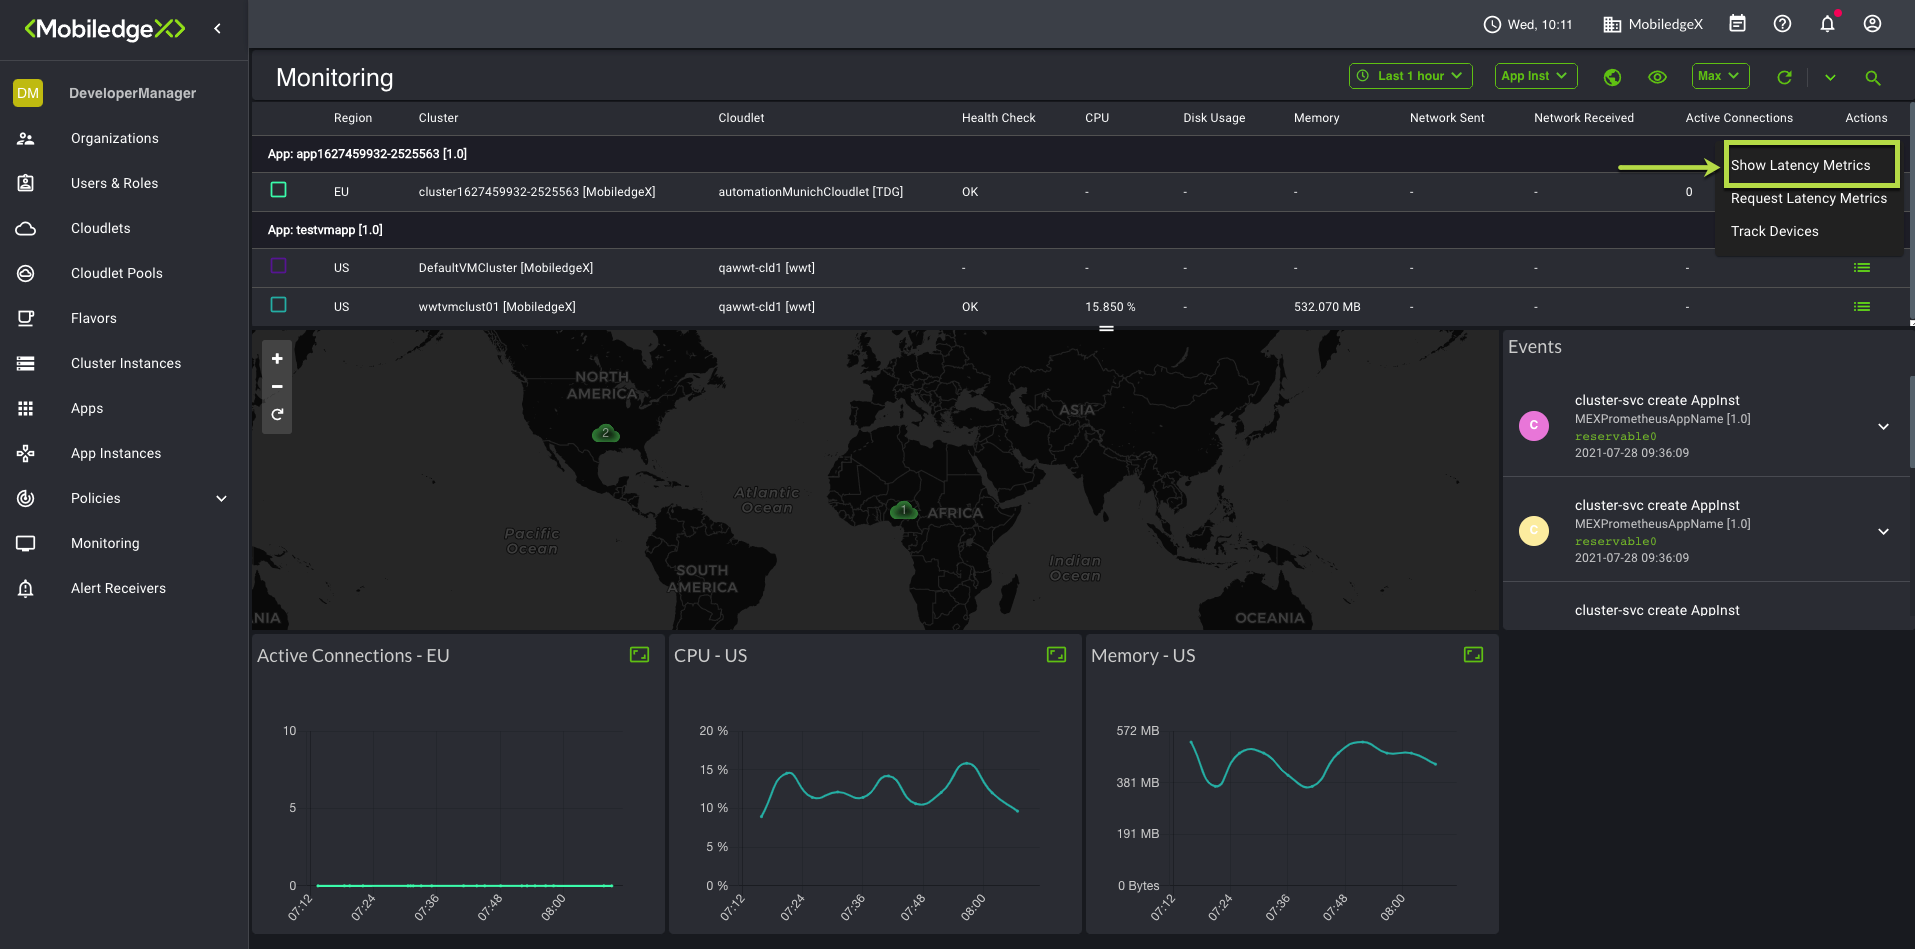
The Cloudlet Location default page opens where you can view latency information for app instances.
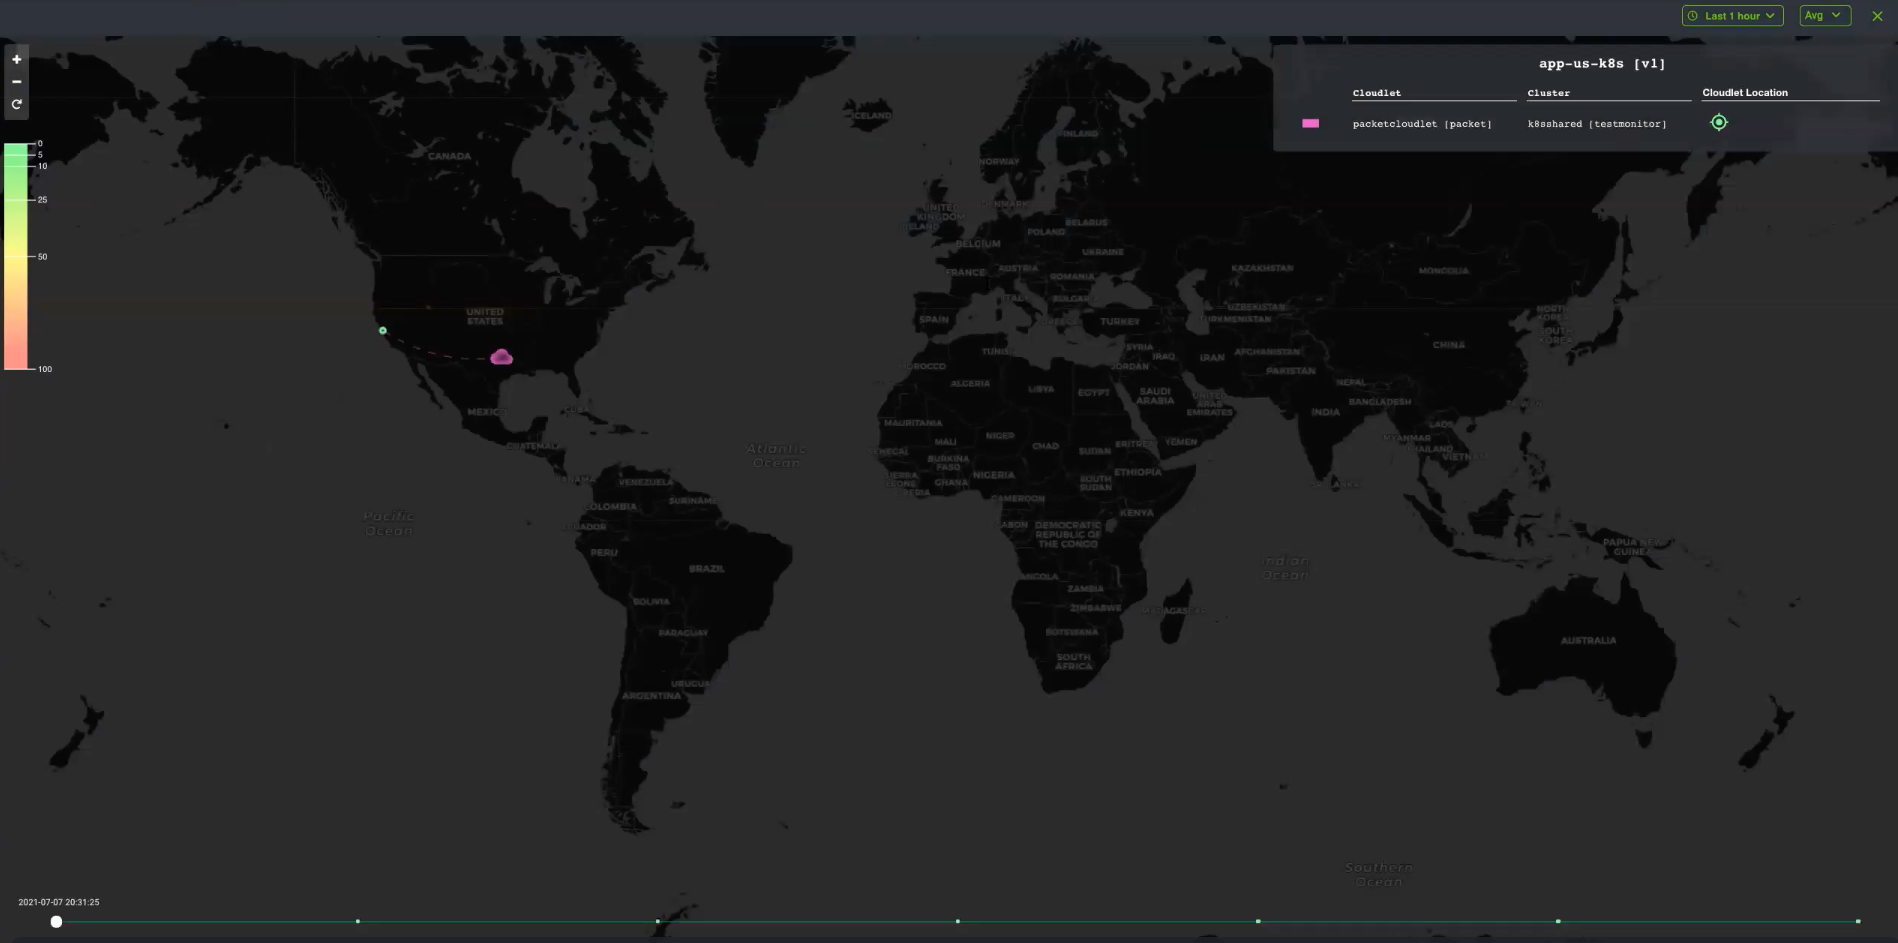
Displayed on the upper-right hand side is the cloudlet information in which the app instance was deployed. On the left-hand side of the page displays the latency info (heatmap). Down at the bottom is a time slider where you can view aggregated latency data based on the timeline.
Click the Cloudlet Location icon to view the overall cloudlet latency information. The following screen opens.
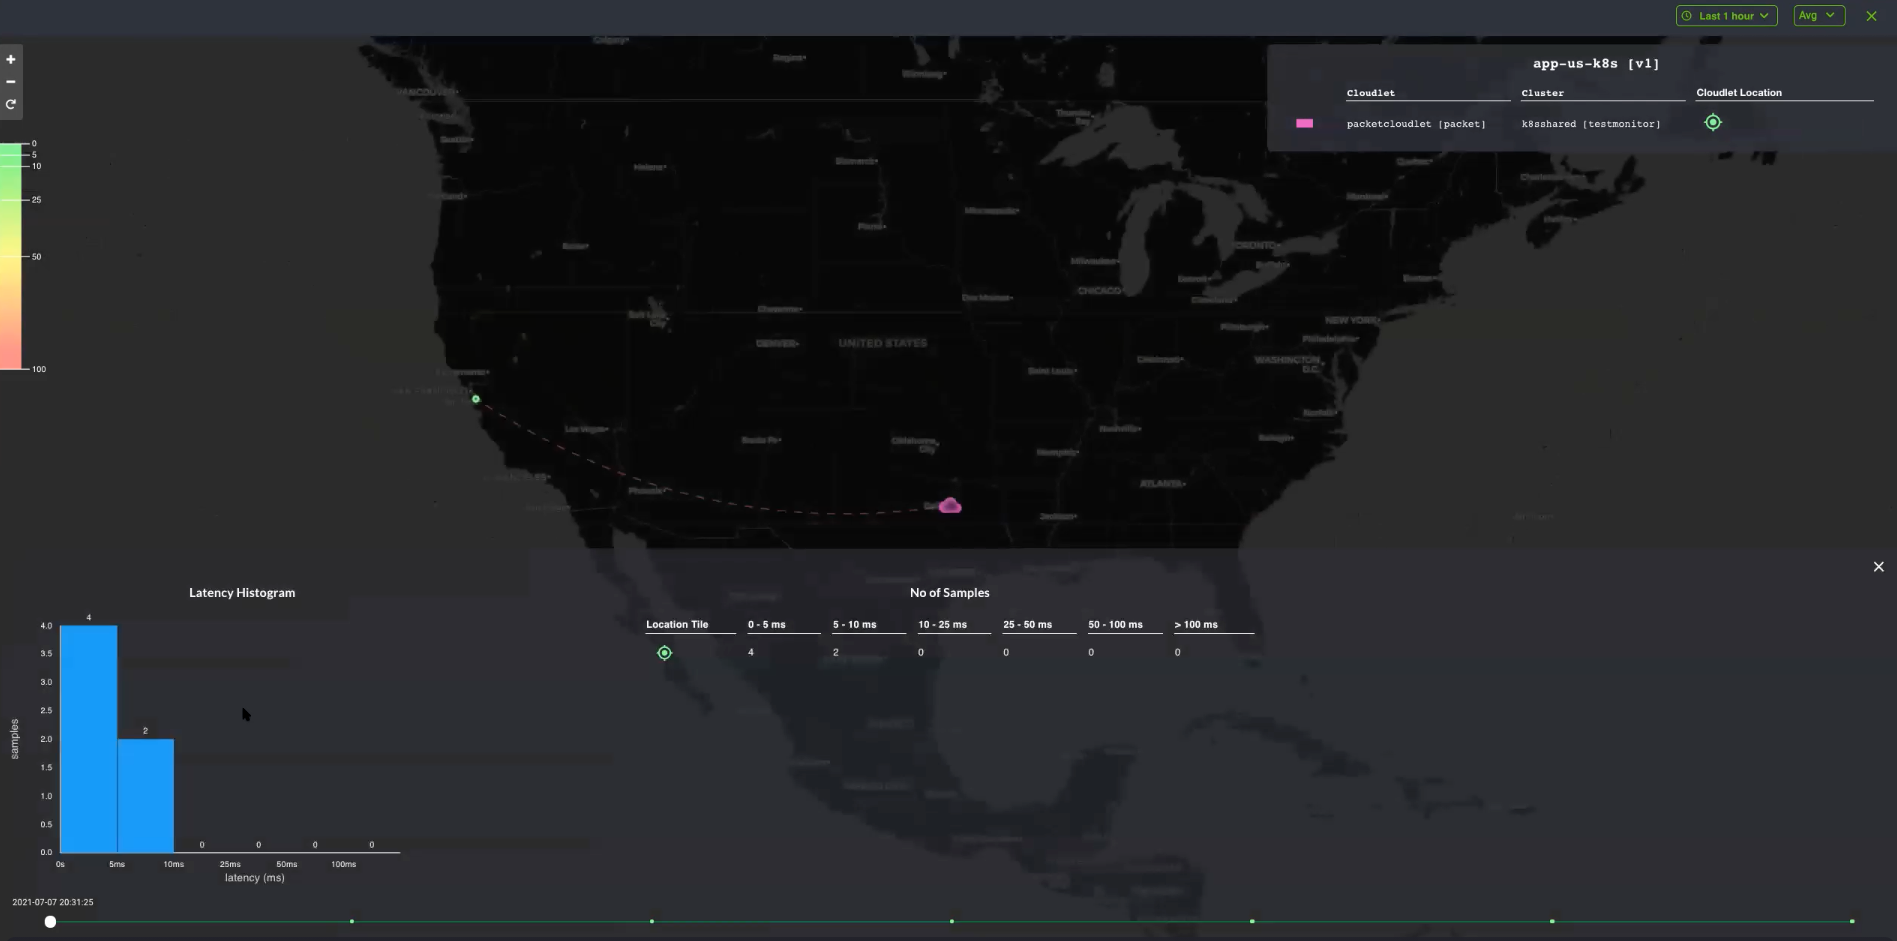
The purple cloud that you see in the sample above displays the average latency data based on cloudlets, and not location.
To drill down, click the Location tile icon to display the cloudlet location.

Slide the timer slider to check the average latency for each cloudlet based on the time range.
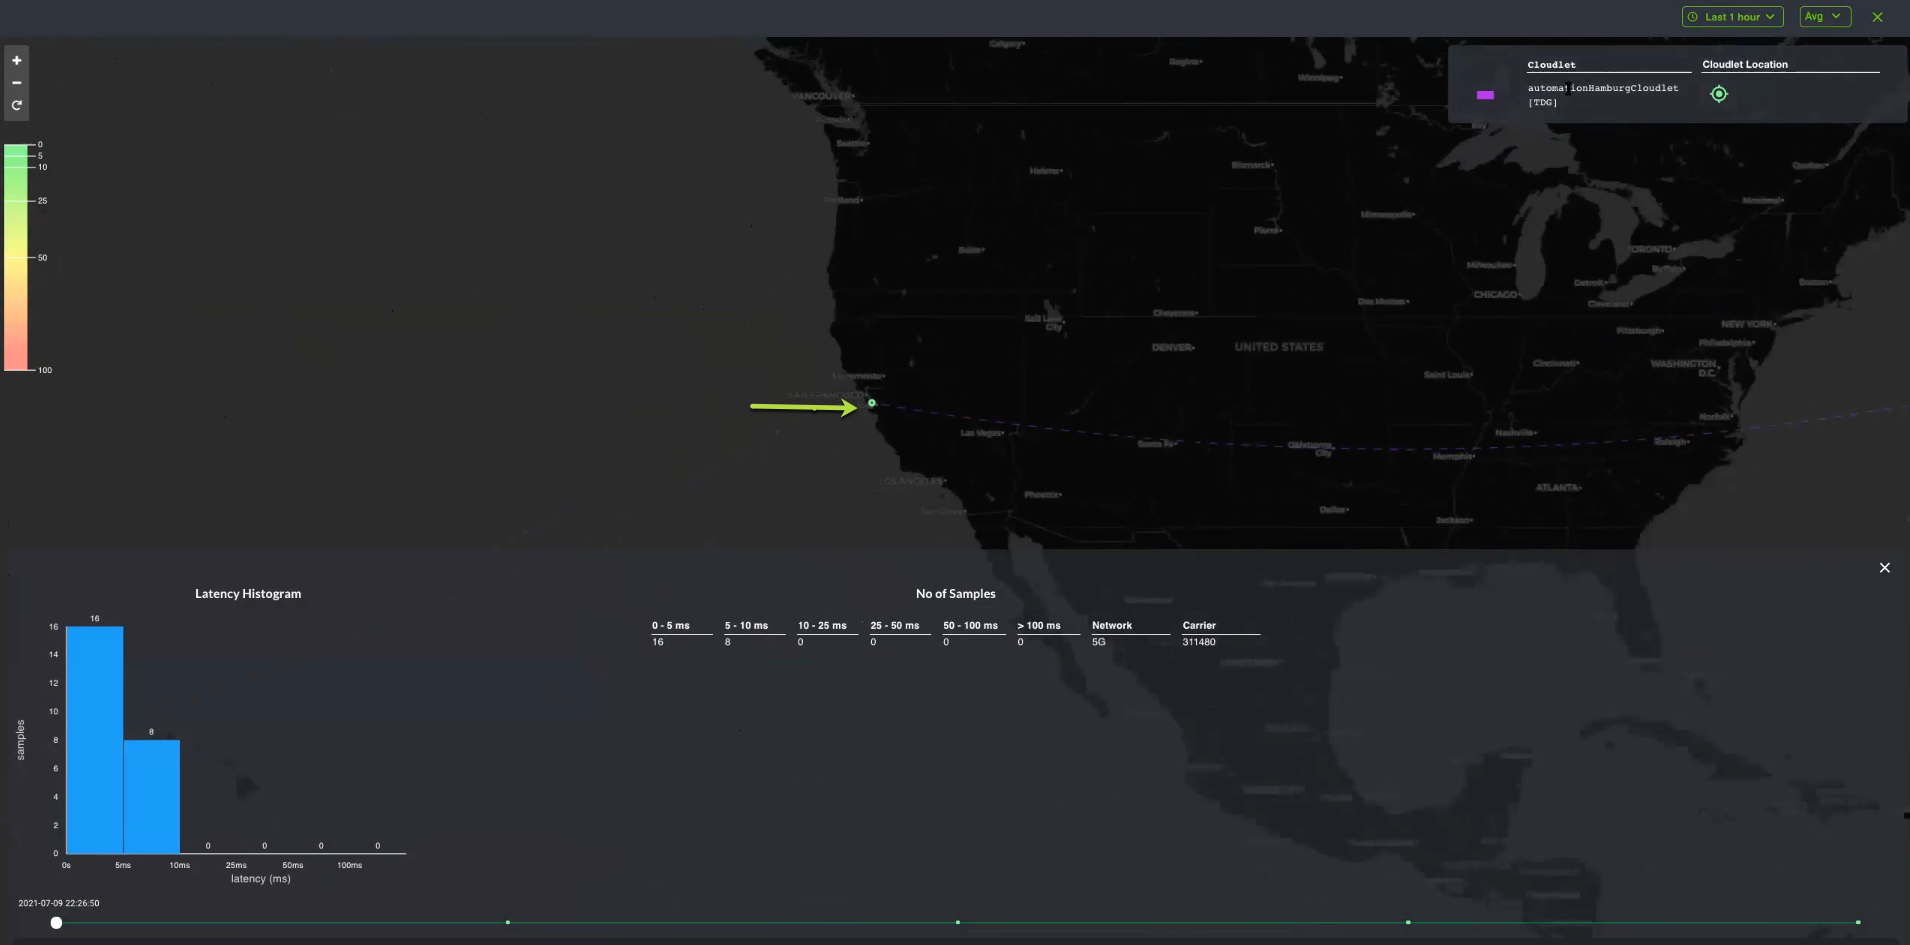
As you slide the timer slider at the bottom, which monitors latency and performance degradation over time, the aggregate latency data may change based on the timeline, where each dot on the timer slider represents the latency, which is time-based and captures the average latency.
Note that the number of samples display devices on various Networks, such as 4G, or 5G. If you have a number of devices that are on 4G and other devices on 5G, you will see multiple entries which will display statistical data segmented by the Network used for those devices.
Performance is considered optimal when the Location tile is green, along with the Cloudlet Location tile, and falls under 0-5 or 5-10 milliseconds. Latency falling under 10-25ms and 25-50ms will be yellow, while 50-100ms and greater is red, indicating performance degradation.