How To Stress Test an Application Instance for Production
Stress Testing is an important part of making sure your application is ready for production and can scale to handle the maximum expected workload. There are several available open source tools that developers can leverage :
In this guide, we will be taking a look specifically at setting up an example stress test using Artillery against a Web Server Application Instance. This test will ramp up, maintain, and then ramp down the number of active requests per second.
We will then show how you can run this test and monitor the activity within the EdgeXR console.
Prerequisite
- To install Artillery, you will need to have installed npm.
Setting Up Artillery
Installation
To install artillery, you can use npm to install it either globally as a command on your machine or you can also install it to a local working directory. For more information, you can refer to the artillery Getting Started guide.
Globally:
sudo npm install -g artillery
Locally:
npm install artillery
If you choose to install artillery in a local working directory, you will need to navigate to node_modulues/artillery/bin to run artillery commands.
Useage
The artillery documentation provides several great examples on how to configure various tests. The configuration file is written in YAML and requires two primary sections : config and scenarios. Here is an example:
config:
  target: "http://autoclusterhelloworld.dusseldorf-main-tdg.eu.app.tdg.edgexr.org"
  phases:
    - duration: 30
      arrivalRate: 0
      rampTo: 50
      name: "Warm up the application"
    - duration: 60
      arrivalRate: 50
      name: "Sustained max load"
    - duration: 30
      arrivalRate: 50
      rampTo: 0
      name: "Ramp down connections"
scenarios:
  - flow:
      - get:
          url: "/"
In the config section, you provide the URI of the backend you would like to test as a target. Afterwards, you can setup different phases for the stress test. As mentioned at the beginning, we are interested in setting up a test where we ramp up, maintain, and then ramp down the number of connections.
For that, we need to setup 3 different phases, each with its own:
- duration : how long the test runs in seconds
- arrivalRate : the number of connection attempts per second
- rampTo (optional) : the number of connection attempts per second at the end of the test
In the scenarios section, you can set up multiple test “flows” for how a user may use your application. For just testing a web server, we simply want to stress test the response of the home page. But for more advanced flows, you can specify hitting multiple end points sequentially and providing various payloads as is shown on this page of the artillery documentation :
Once you have customized the configuration file specifically for your backend, you can then run artillery:
artillery run --output report.json configuration.yml
As the test is running, you should see in the terminal a report every 10 seconds that shows the number of tests that were performed in that time period as well as some statistics on the response. At the end of the test, this will also create a summary report file in JSON. For more information on how your application instance is performing, you will need to refer to the EdgeXR Monitoring Tools.
Started phase 1 (Sustained max load), duration: 60s @ 16:48:00(-0800) 2020-11-30
Report @ 16:48:09(-0800) 2020-11-30
Elapsed time: 40 seconds
  Scenarios launched:  2499
  Scenarios completed: 1998
  Requests completed:  2013
  Mean response/sec: 250.4
  Response time (msec):
    min: 878.9
    max: 7410.3
    median: 1241.4
    p95: 4520.3
    p99: 5448.7
  Codes:
    200: 2013
  Errors:
    ECONNRESET: 23
Viewing Monitoring Data
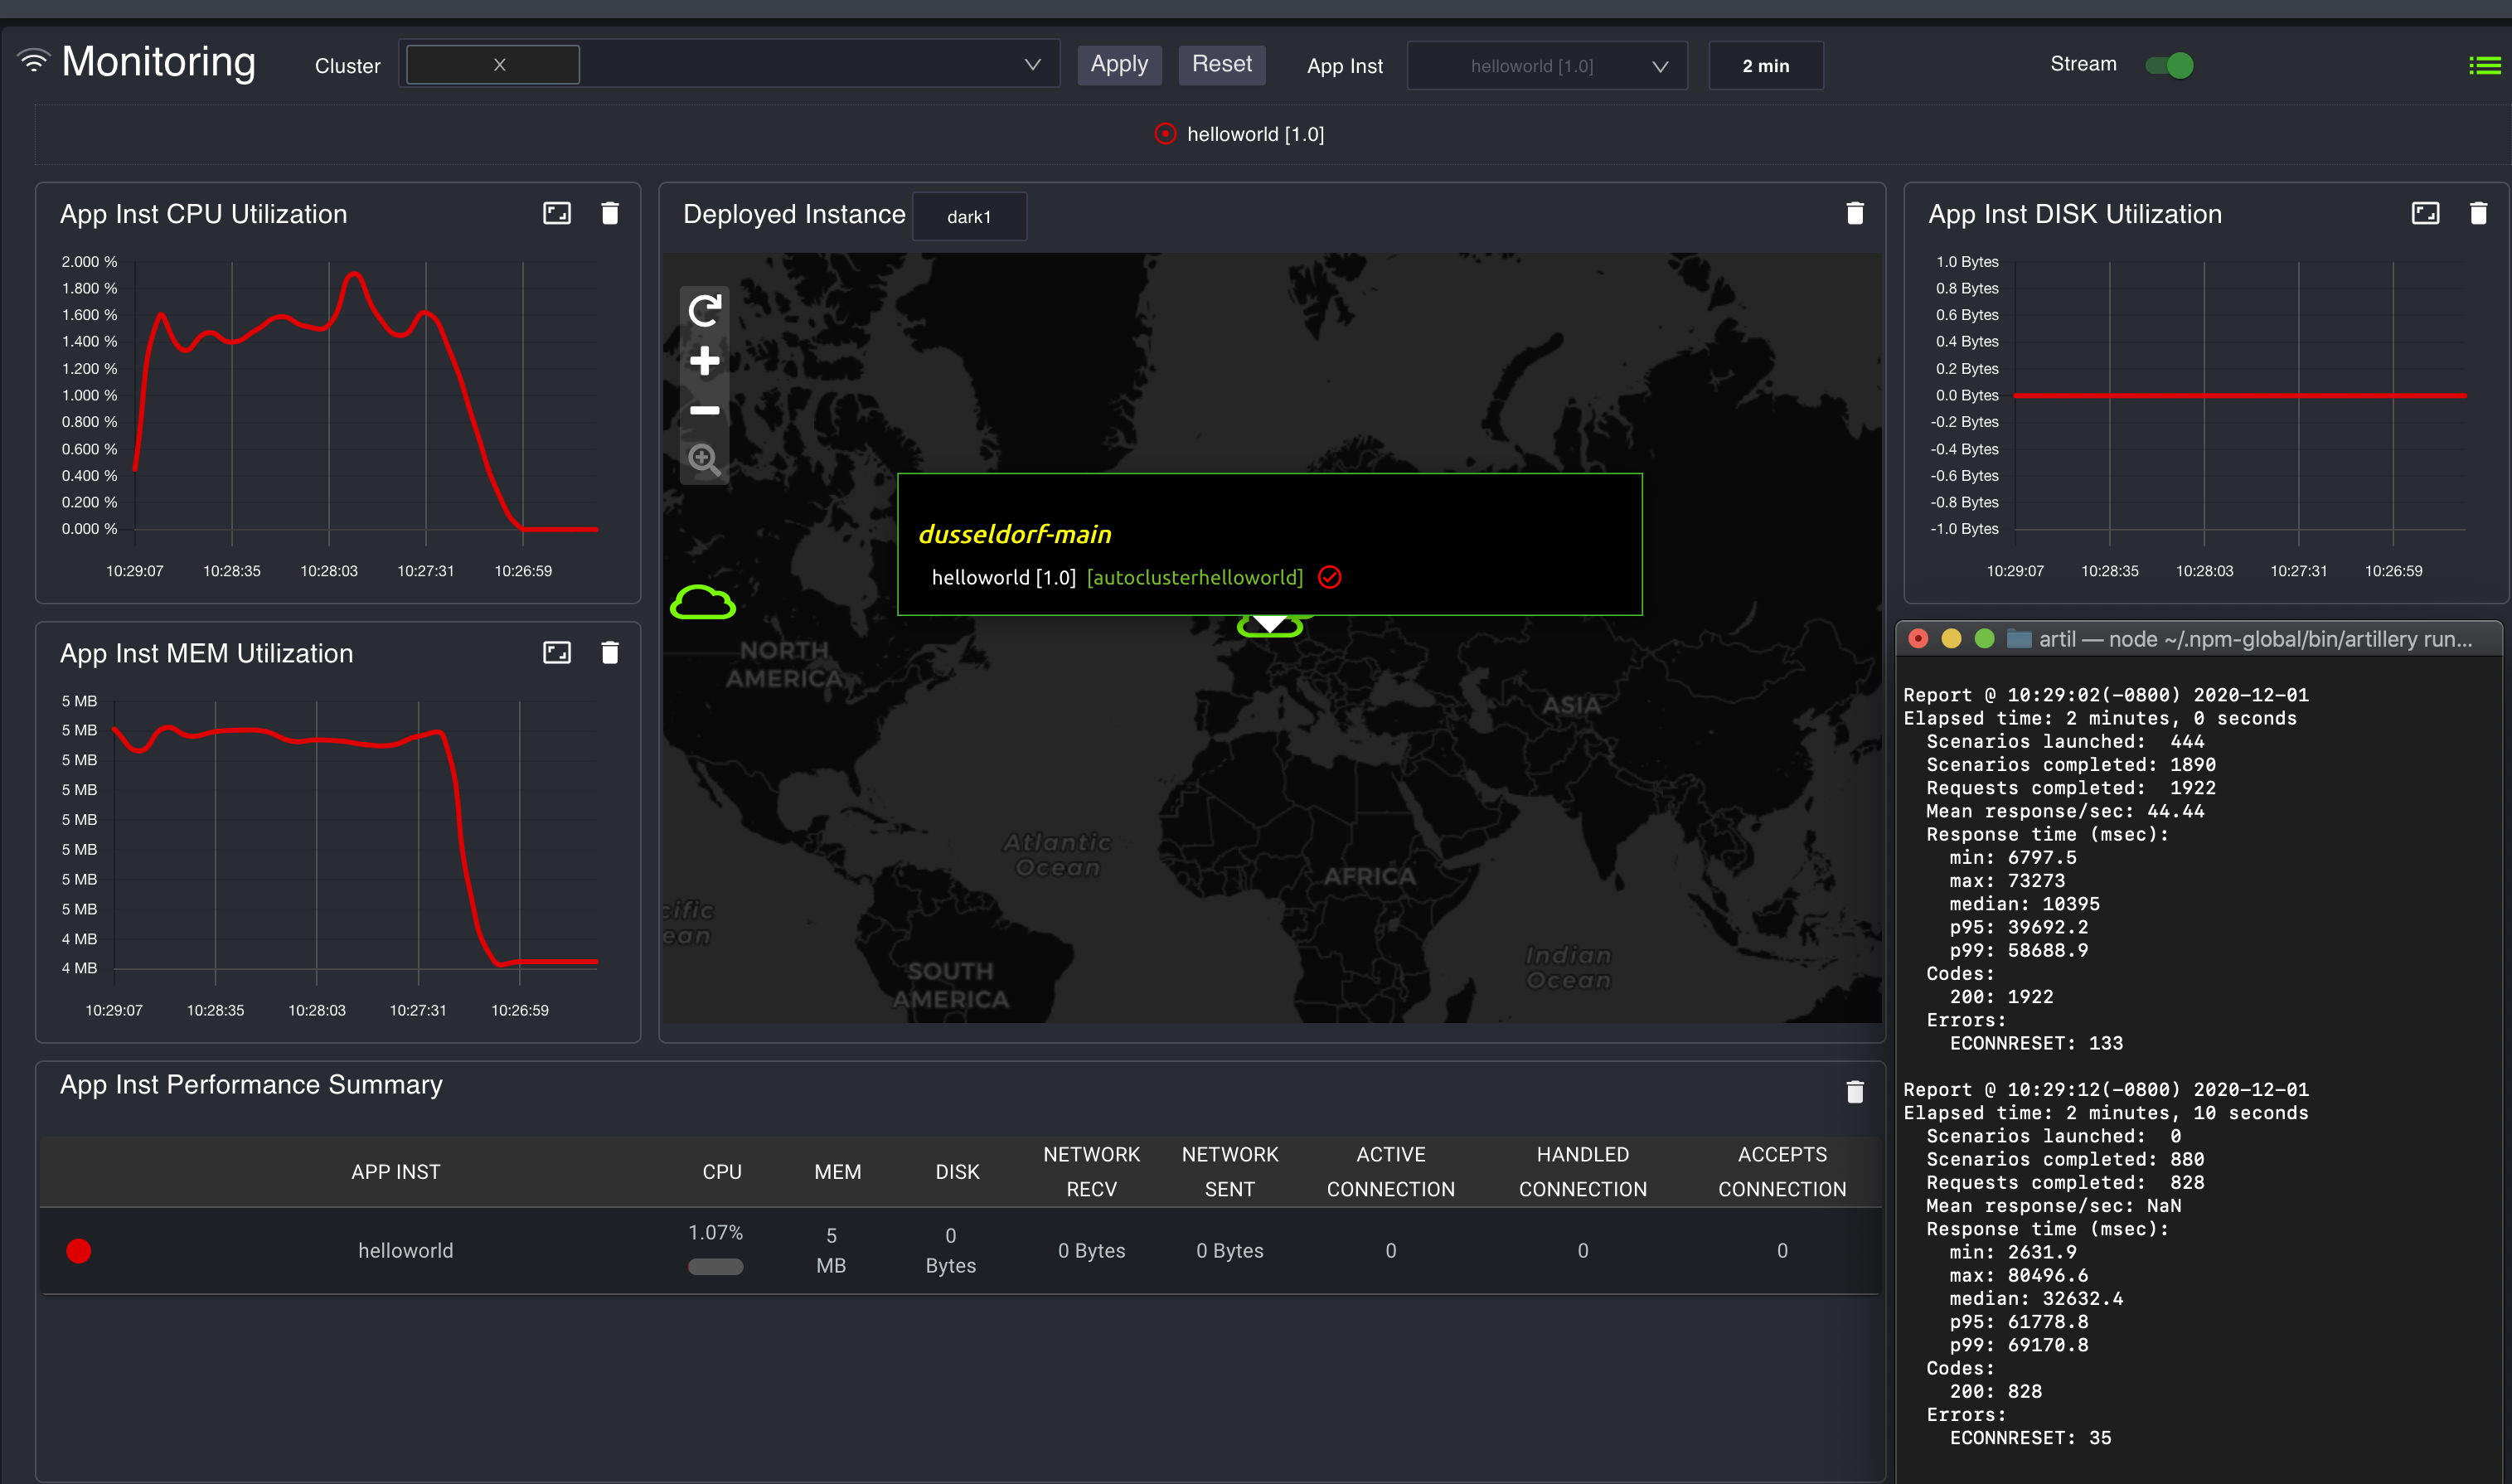
In the EdgeXR Console, head to the Monitoring tab. This page let’s you see all the metrics data associated with all of your running Application Instances. You can select a specific Application Instance in order to view the performance data associated with that instance such as the CPU, Memory, and Network Usage. For more information on Monitoring, you can refer to our Monitoring Documentation.
You can also use the Stream option in the top right in order to monitor real time data, which is perfect to monitor while your Stress Test is running.
If you see that the utilization is too high for your use case, you may need to consider either changing your application to run on a larger flavor or alternatively if you are using Kubernetes, you may want to change your thresholds for leveraging auto-scaling.
